The Ultimate List of SMS Marketing Statistics
Published: Aug 29, 2022

SMS marketing has evolved significantly over the years. It has become a powerful tool for businesses to reach their target audiences. The ability to send texts to customers and prospects has made it an essential part of any marketing mix, especially considering its ROI.
This widely used communication channel has continued to grow as small businesses and large corporations have become more aware of its potential. The number of companies using text message marketing has risen significantly, along with an uptick in the number of messages sent each day. This is due to the fact that text messaging is an extremely effective way to reach both customers and prospects alike. As a result, the figures have been on the rise in the past decade, making SMS a more effective channel than social media or other platforms.
The competitive market has led to many companies vying for attention. As a matter of fact, it has resulted in the development of innovative ways and best practices for using SMS to reach customers. Businesses are now using it to send coupons, special offers, and even reminders.
While it has come a long way since it first appeared, texting is now an essential part of any marketing mix. Let’s take a look at SMS marketing statistics from 2015 to 2023, including a few SMS versus email marketing stats.

Texting and Mobile Phone Facts of 2015
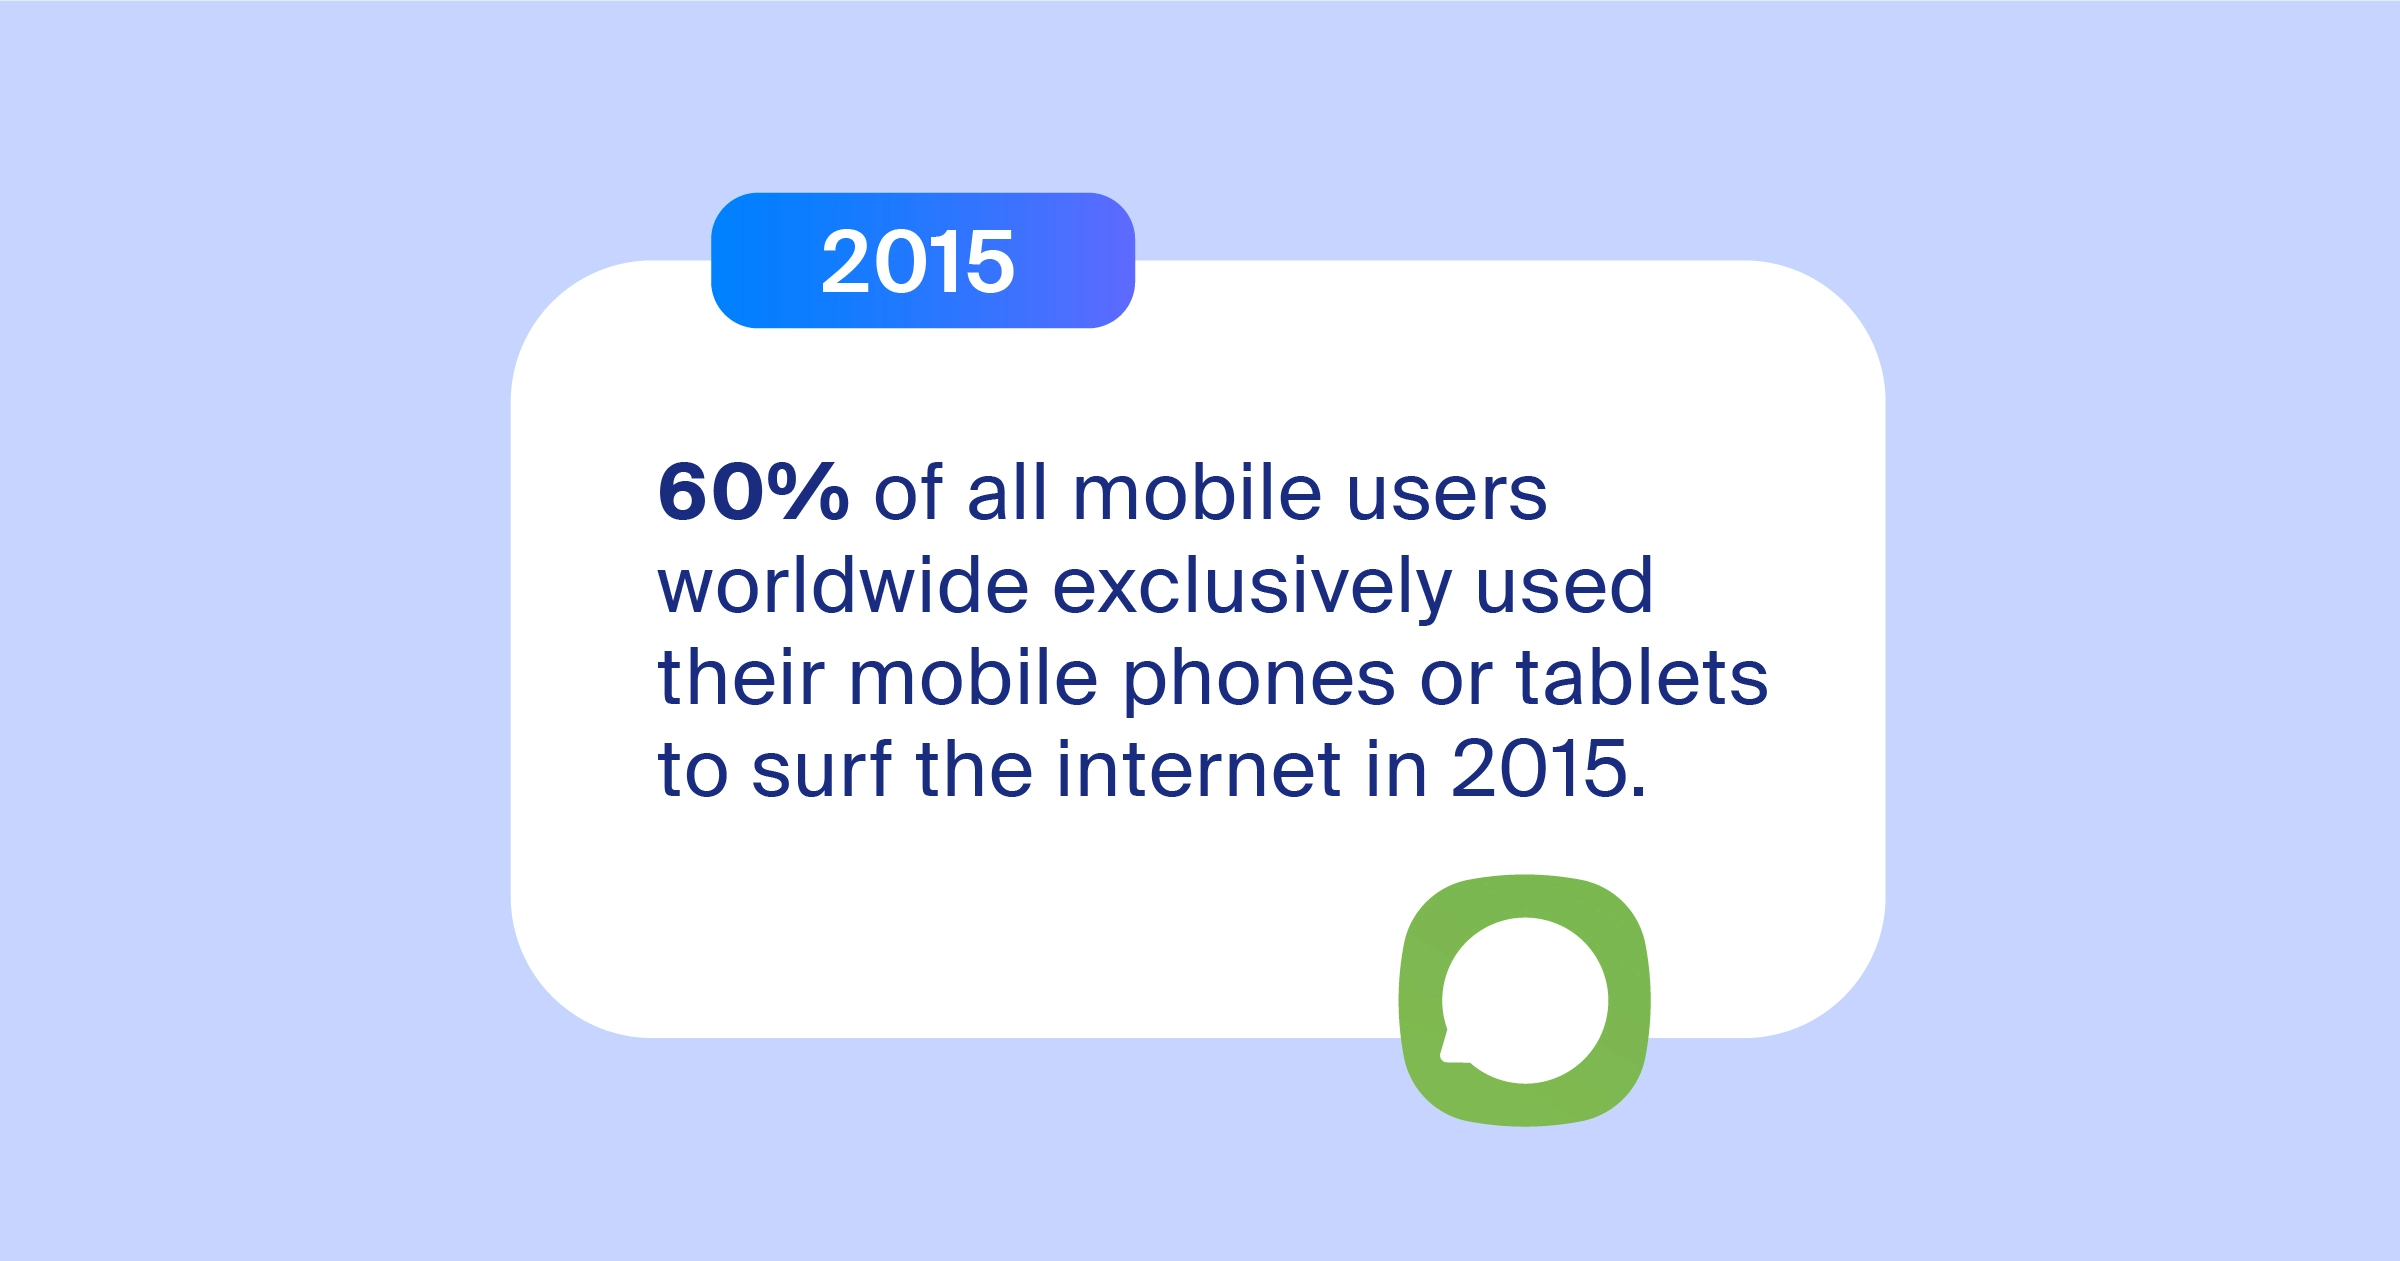
60% of People Use Their Mobile Devices for Web Surfing
According to Text Marketer, 60% of all mobile users worldwide exclusively used their mobile phones or tablets to surf the internet. The average person consumed media for seven hours. Of those seven hours, 1.8 were spent on their mobile devices, 1.6 hours on their computers, 1.5 watching television, and the remaining 2.1 using other media.
50% of Visits to eCommerce Sites Are from Mobile Devices
Mobile users also used their mobile phones for shopping, accounting for 50% of visits to eCommerce websites in 2015. Consumers who subscribe to mobile text messages claimed that brand communications have influenced purchases in 64% of cases.
The Majority of Customers Prefer to Communicate With Businesses via SMS
According to 76% of respondents, they would check their text messages before an email. 70% of consumers said that marketers can capture their attention by using SMS. Customers believed that brands must communicate with them via SMS in 64% of cases.
SMS Marketing Pricing
We use a pay-as-you-go pricing model, meaning we charge per sent message. No monthly or sign-up fees. SMS marketing costs vary depending on your destination.
Text Marketing Statistics Recorded in 2016
Adults Text for 23 Hours per Week
The typical adult texted for a combined total of 23 hours every week, whereas the typical millennial sent and received 67 text messages every day. Nearly 43% of smartphone users carried out their communications via phone calls, while more than 70% of them made use of texting instead.
Also, 80% of individuals used texting for commercial purposes. From the business side, retail had a response rate of 32% within 15 minutes of delivery whereas trading had 33%, entertainment had 37%, travel had 54%, and banking had 57%.
Texting Proved to Be More Successful Than Other Channels
Personalized SMS marketing campaigns performed nearly seven times better than their email counterparts. Coupon redemption rates for SMS-delivered ones were 10 times greater than those of printed coupons. In addition, more than 50% of mobile search users made a purchase as a result of their search, and only 10% of texts that were received were deemed to be spam.

Business Messaging Statistics of 2017
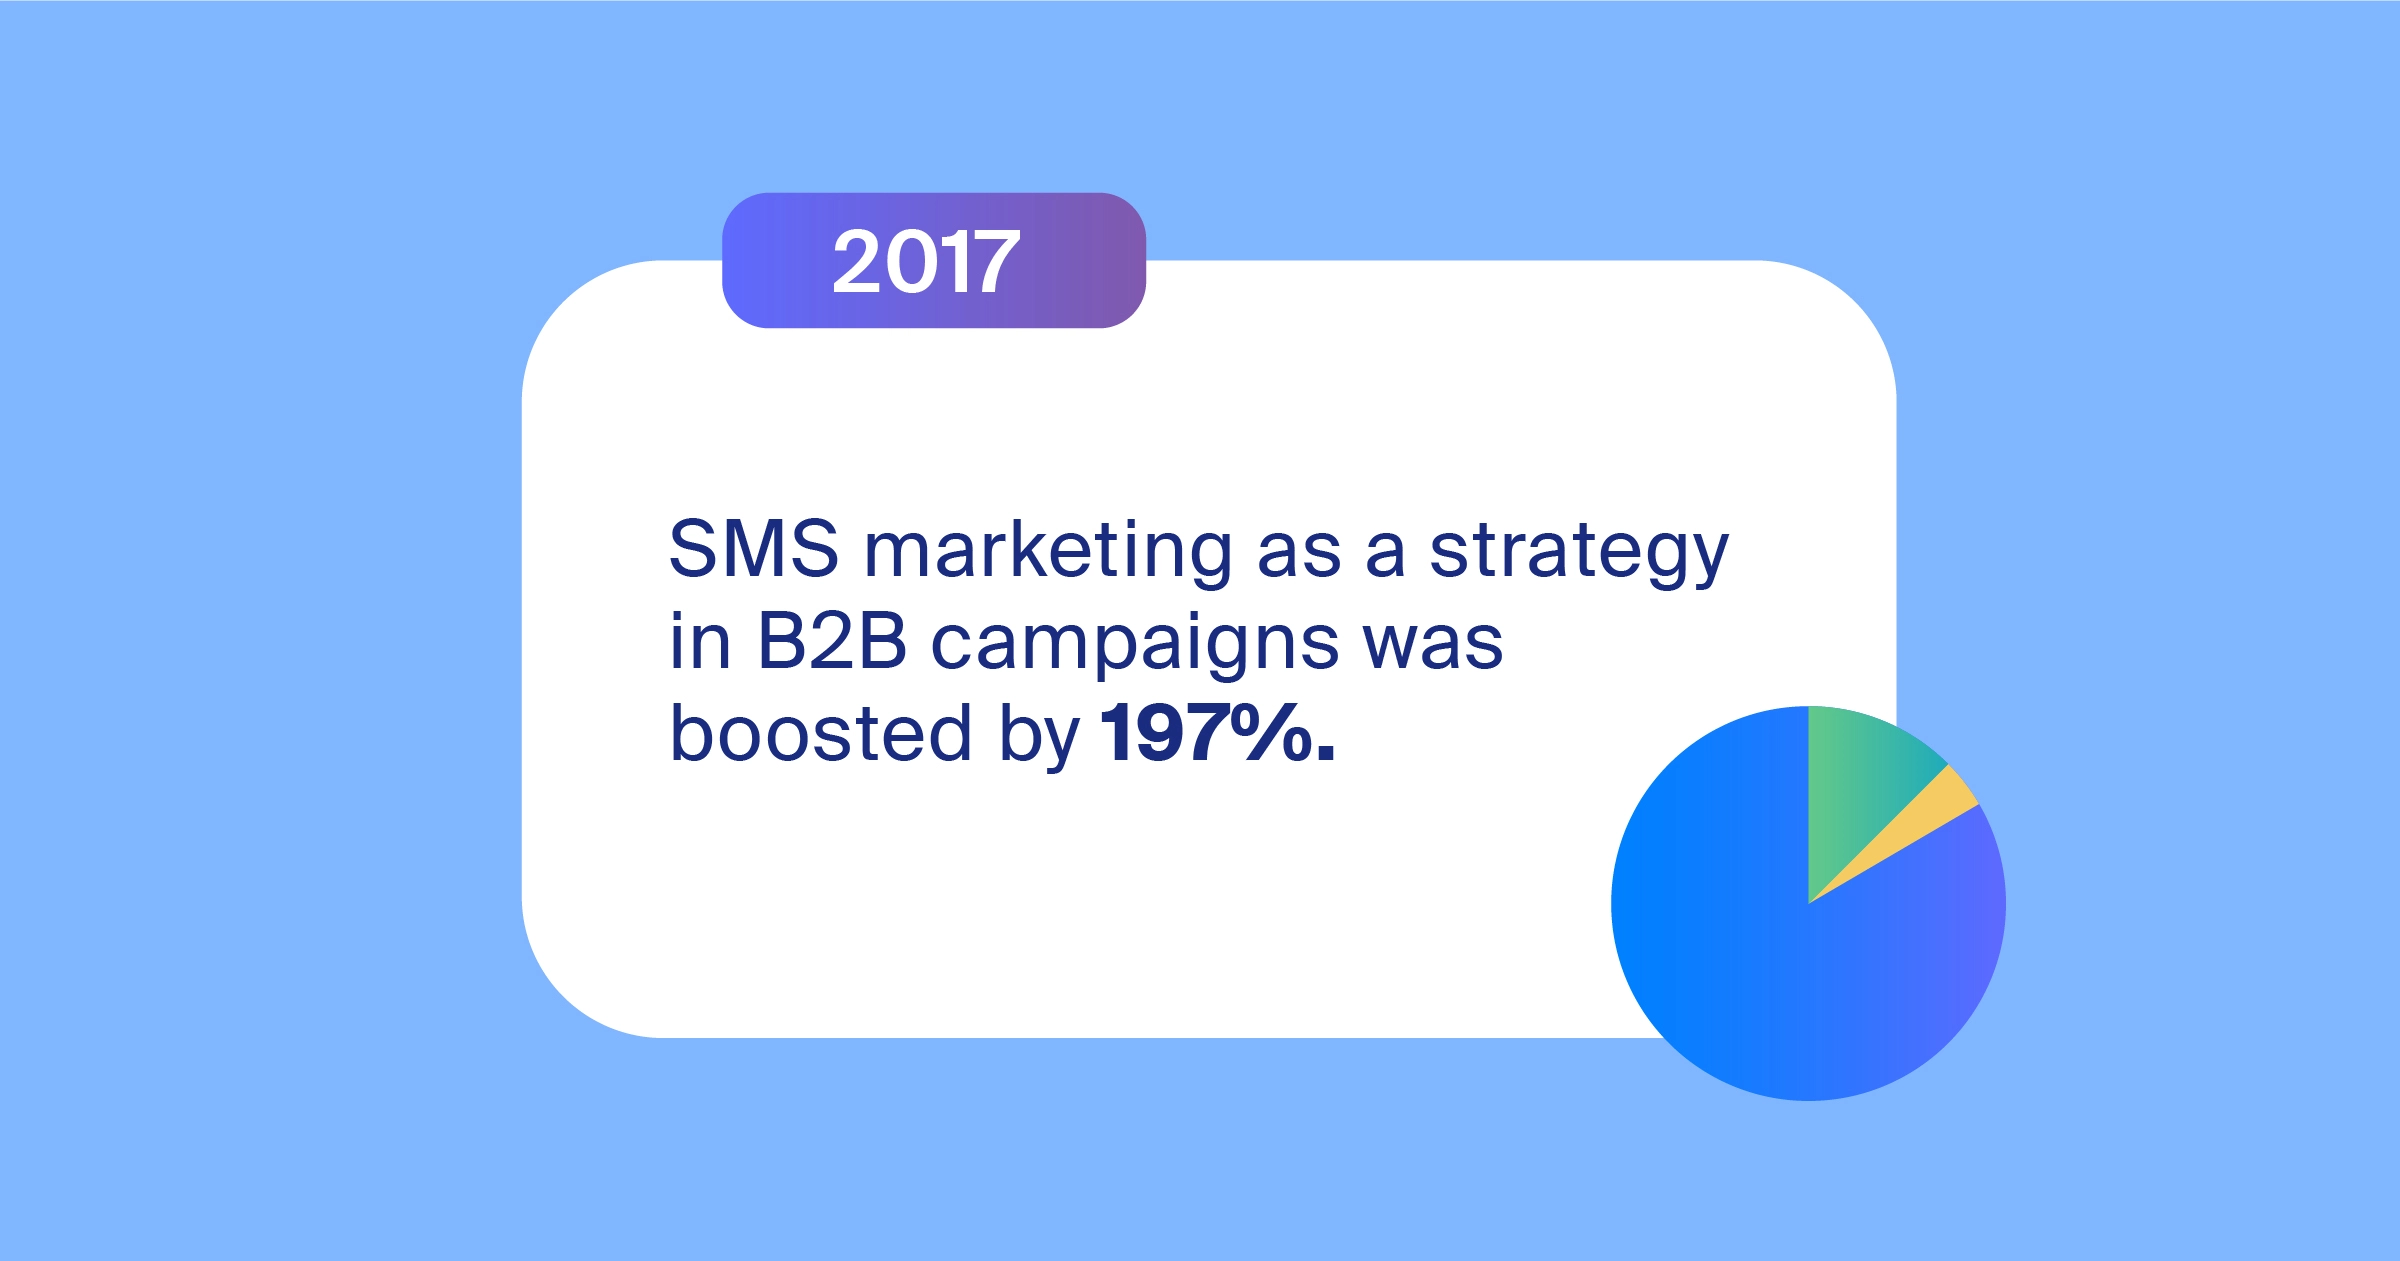
Text Marketing for B2B Increased by 197%
Between 2015 and 2017, the adoption of SMS marketing as a strategy in B2B campaigns skyrocketed by a whopping 197%. Despite that, less than half of all campaigns were created using texting as a communication channel.
16 Million Text Messages Are Sent Each Minute
8.3 trillion messages went out globally in the same year. This translates to 16 million texts each minute. Around 1.67 trillion of those were business texts delivered via a platform like Dexatel. This shows how effective and efficient it can be to send and receive text messages using a specialized SMS marketing platform.
64% of Americans Prefer Companies That Communicate via SMS
According to Text Request's SMS marketing stats, 64% of US consumers said they were more likely to have a positive opinion of a company if it offered texting. Moreover, research by Adestra reported that three out of four consumers wished to receive text messages from businesses for updates and special offers.
Text Message Marketing Facts Reported in 2018
The 2018 SMS Market Was Valued at $3.5 Billion
In 2018, the SMS market was worth $3.5 billion. Over 66% of people as a whole used SMS services for business communications that year. There were over 500 million communications exchanged each day, totaling about 182 billion annually worldwide. Due to the rapidly expanding market and consumers, 8 out of 10 corporations utilized text and mobile messaging services for communication and advertising.
The Average Person Receives More Emails Than Text Messages
On average, consumers receive fewer text messages than emails. Surveys reveal that 62% receive less than 10 text messages and only 12.5% receive more than 20. In comparison, people receive more than 100 emails per day but only a quarter of those recipients open every email. 70% of text message recipients, on the other hand, go through every SMS they receive.
Moreover, 60% of email recipients don’t engage with the call to action on the spot. 47% have up to 20 unread emails and 9% have more than 100. Only 20% read an email once they receive it on their mobile device while 22% read it after five minutes, 18% after ten minutes, and 19% after an hour.

SMS Messaging Facts and Numbers We Saw in 2019
Popularity of Texting in the UK Leads to £142 Million in Revenues
According to a 2019 report, 76% of UK mobile phone users exchange text messages every day. In the UK, SMS generated revenues of £142 million in the second quarter of 2019. Companies spent $165.7 billion on mobile advertisements in 2019. 90% of US customers said they preferred to receive text marketing in that year. SMS marketing had a 45% conversion rate.
61% of Businesses Still Don’t Use Text Marketing
Despite the growing popularity of texting, the majority of businesses are yet to adopt it as part of their marketing efforts. 61% of businesses don’t make use of text marketing to connect with their audience. This gives the remaining 39% the competitive edge they need to stand out in the market.
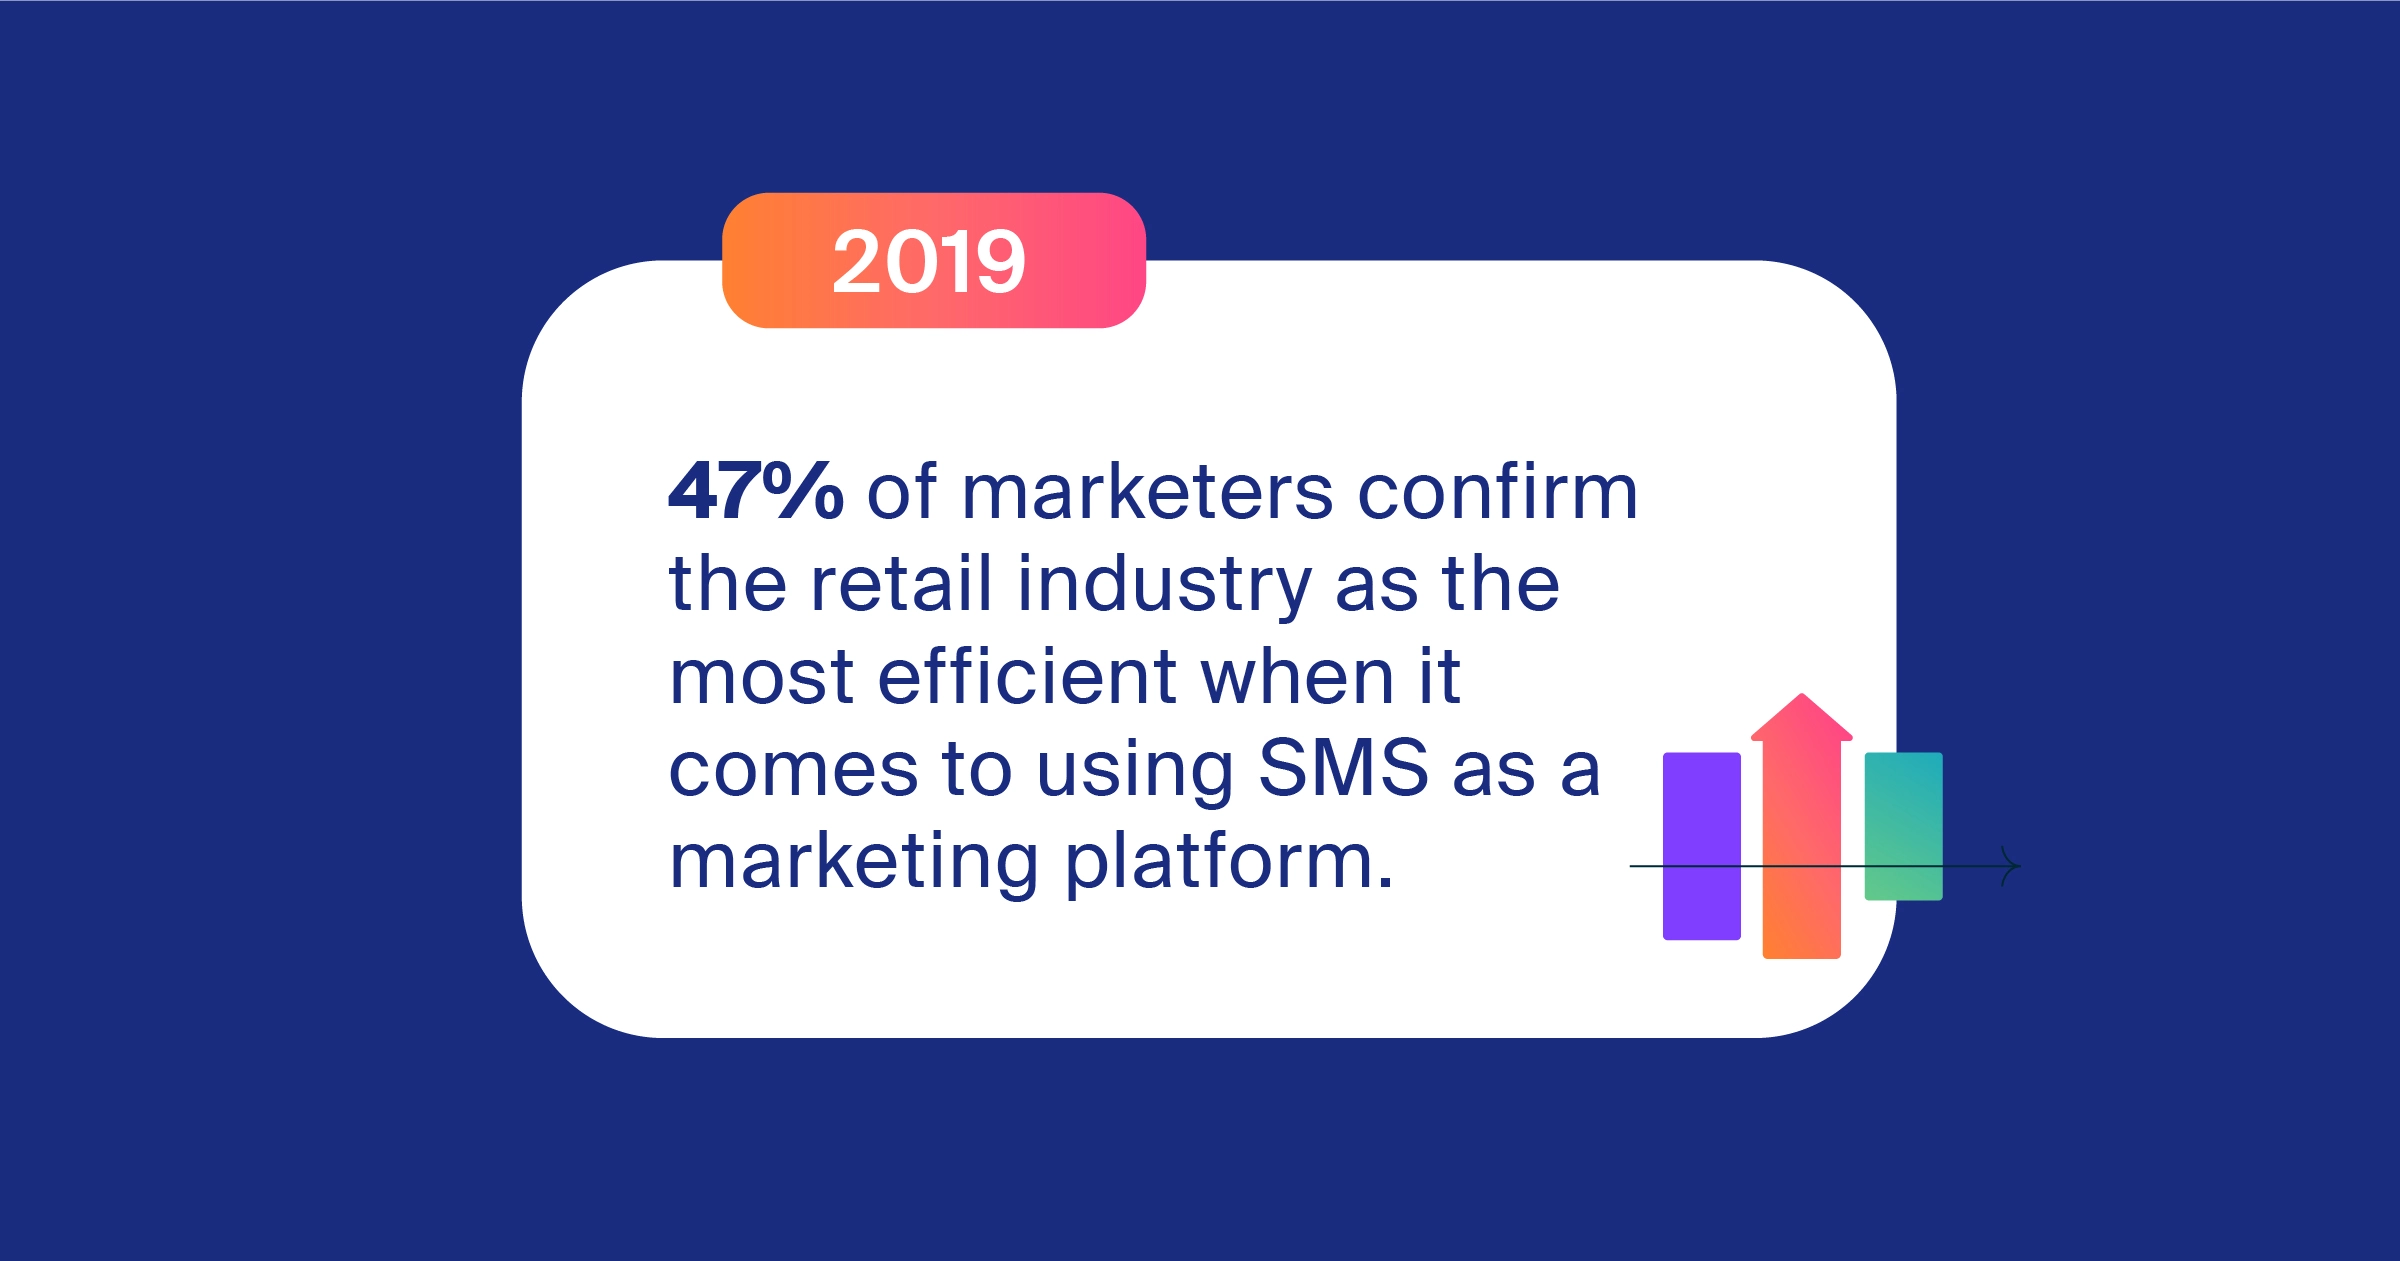
Retail Reigns Supreme in Text Message Marketing
The industry that takes the lead in terms of marketing is retail. 47% of marketers admit that the retail industry is the most efficient when it comes to using SMS as a marketing platform. This shows how fierce the competition can be in the retail market. It also indicates that any business looking to come up with effective an SMS marketing strategy can use the retail industry as an example.
SMS Campaign and Texting Facts of 2020
The Number of Active SMS Users Hits 3.5 Billion Worldwide
According to a Statista study, there were approximately 3.5 billion active text users worldwide in 2020, and SMS usage was growing at a rate of approximately 5% per year. The average number of messages sent and received per day was expected to continue to increase, reaching over 20 billion by the end of 2020.
SMS Messaging Is Popular Among Americans
In the United States, the average adult sent and received around 10 text messages per day, while teenagers sent and received texts an average of around 60 per day. The popularity of texting among Americans is also reflected in text message marketing. A study by the Direct Marketing Association revealed that opt-in SMS marketing campaigns had a 97% success rate.
Consumers Receive Fewer Text Messages Than They Want to
According to trends, there is a stark difference between the demand and supply of marketing messages. 54% of customers across most age groups want to receive texts from marketers—this includes 75% of people under the age of 44. On the other hand, only 11% of businesses as a total are communicating via SMS.
Text Messaging Statistics 2021
3 Out of 4 Don’t Mind Getting Texts from Businesses
Research conducted by MarketingProfs indicates that 75% of consumers are okay with getting messages from firms provided they opt in. Additionally, 82% of consumers claimed to read every text they get, with a 36% click-through rate. More than 83% of millennials opened their messages within 90 seconds of receiving them.
SMS Proves to Reduce Company Expenses
Studies prove that using SMS for customer service can potentially help in lowering the expenses of a company. As a matter of fact, 58% of businesses stated that providing customer support through text message resulted in lower costs as well as lower average response times.

SMS Marketing Statistics 2022
Average Spending on Mobile Advertising Will Exceed $336 Billion
According to Statista analysts, by the end of 2022, the average amount spent on mobile advertising will be $336.5 billion. It is predicted that by 2023, 3.6 trillion SMS will be received that are connected to the business. These text marketing statistics from 2022 show how it will continue to be relevant in the years to come.
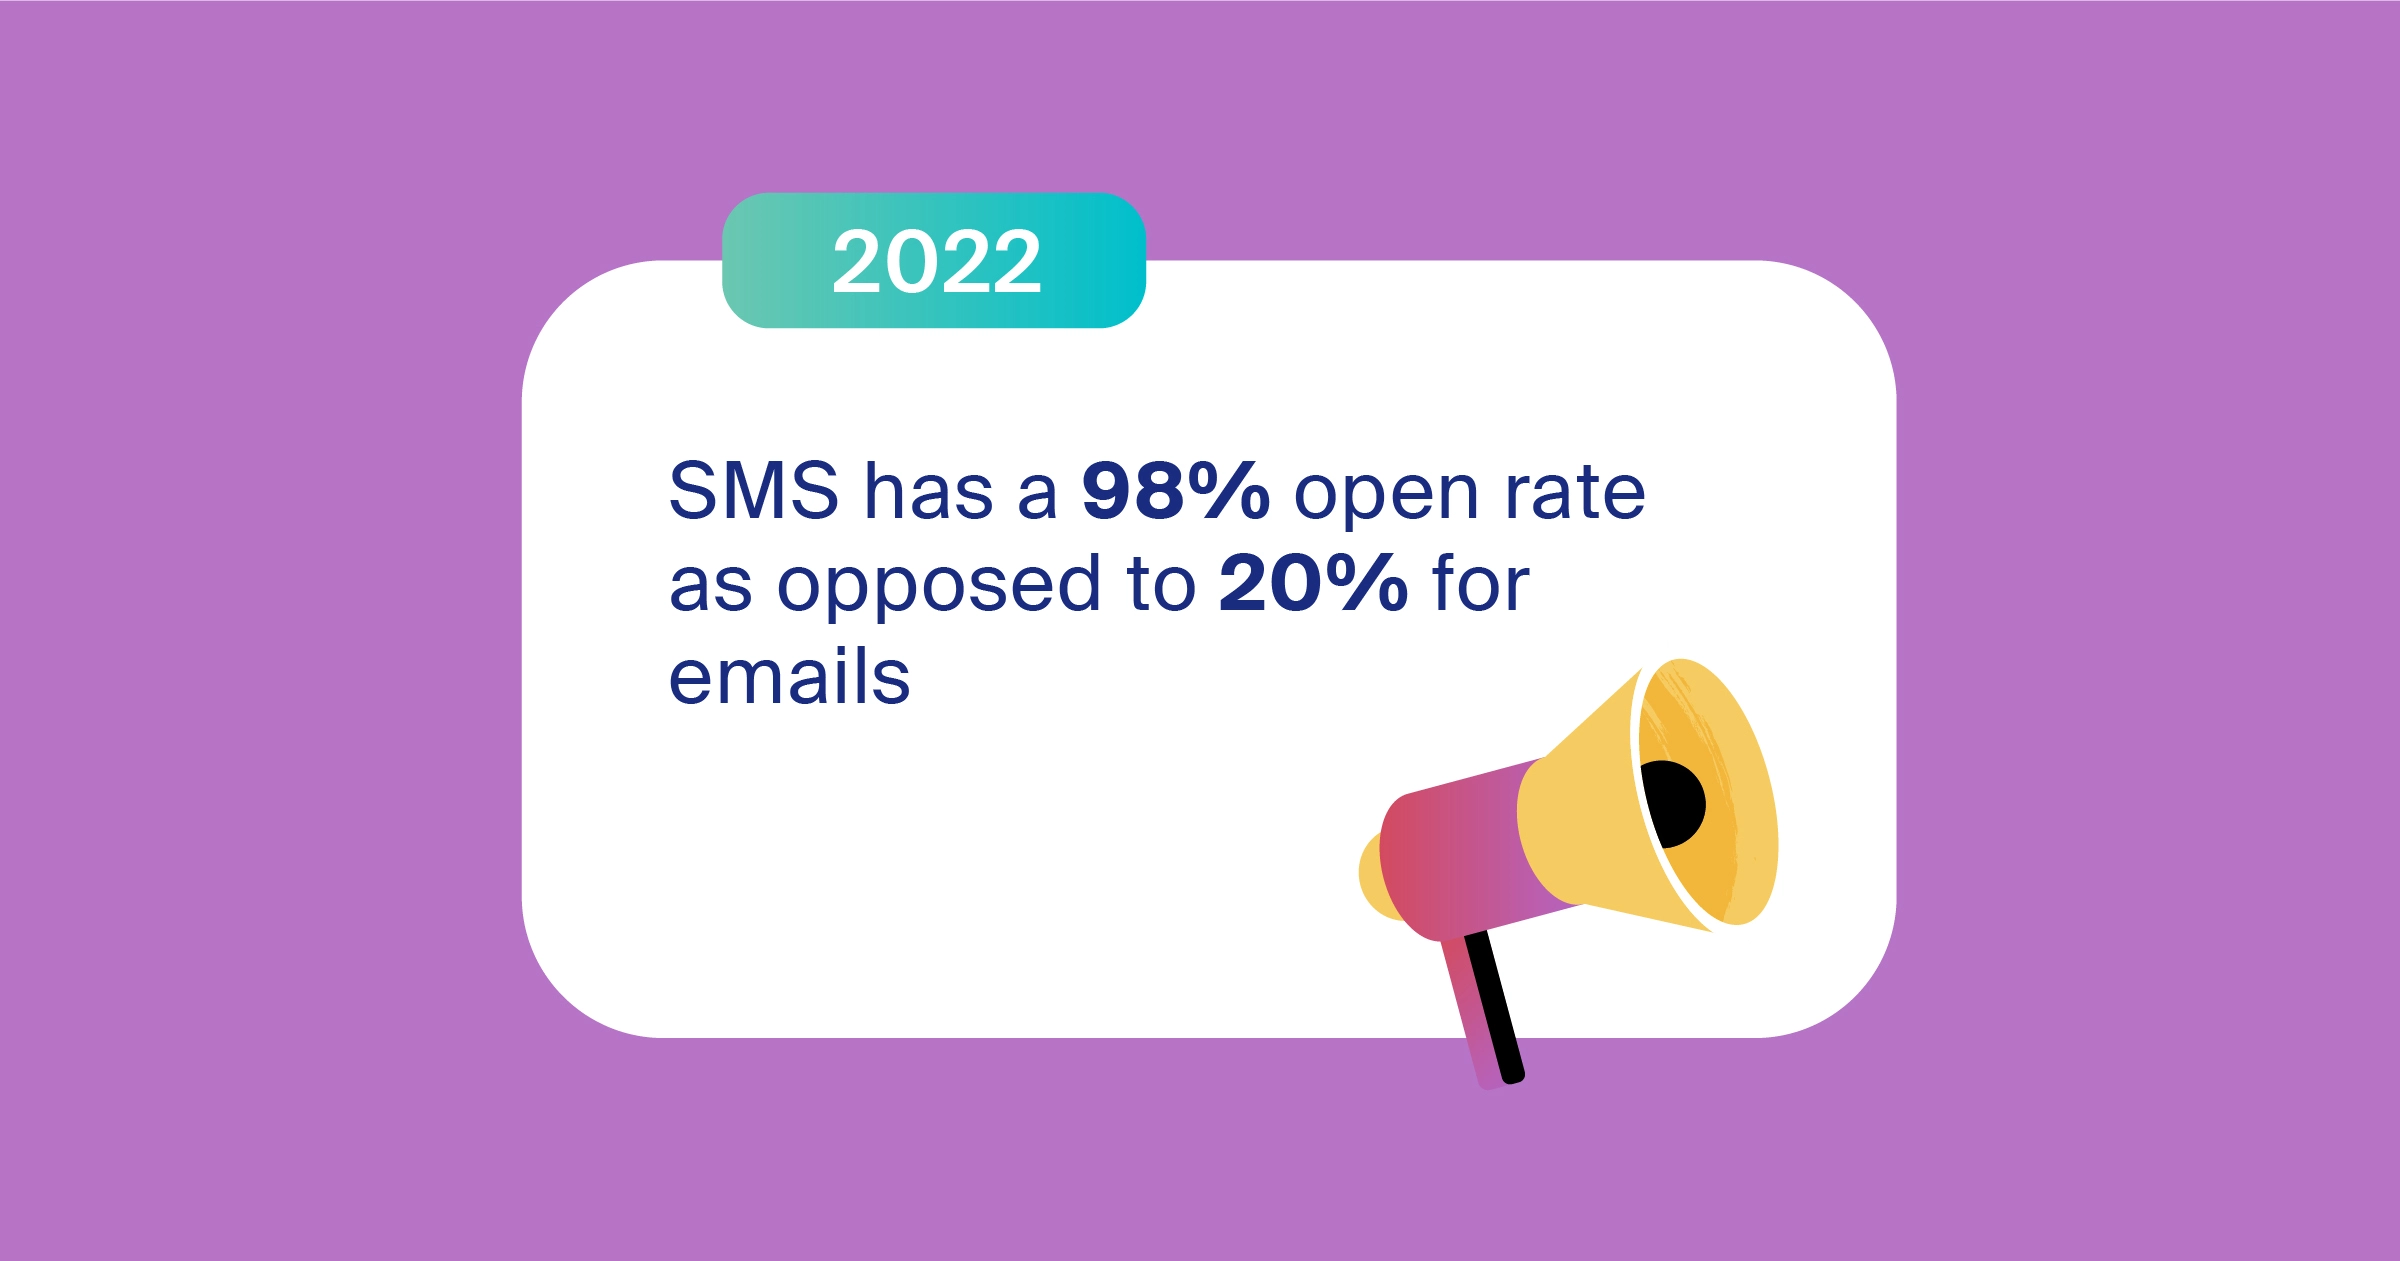
Almost Every Marketing Message Gets Opened
Studies have also claimed that customers between the ages of 18 and 24 usually check their devices 190 times each day, which is double the average. Text messages tend to have a higher effectiveness rate with a 98% SMS open rate as opposed to 20% for emails. Also, SMS texts have a 4.5% higher response rate from customers than email marketing does.
SMS Marketing Facts 2023
42% of Businesses Use SMS
The latest reports show that 42% of businesses make use of SMS marketing services to keep in touch with their customers. 57% of these businesses are planning to expand their budget for text message marketing. Texting had generally shown to be quite successful in attracting customers' attention, being one of the most popular and effective communication mediums since 2018.
Global Spending on SMS Is Over $327 Billion
Businesses worldwide spend over $327 billion on texting, with the United States topping the list. Reports estimate that the market size will double by 2024. Experts reveal that the compound annual growth rate of the SMS market size in the US from 2019 to 2025 is 20.3%.
Top Industries That Use SMS Marketing
Roughly 18% of real estate companies use text marketing to connect with their audiences, followed by almost 16% of agriculture companies. Other top industries that use texting as a marketing tool include entertainment companies at 15.4%, construction at 14%, energy at 13%, and airlines at 12.3%.
90% of Customers Get Value from a Loyalty SMS
Statistics show that 9 out of 10 customers claim to have gained value from being a member of a loyalty program and receiving loyalty texts. Another survey shows that 75% of consumers prefer to receive messages for exclusive offers, and 90% of respondents would rather get a text message than an email or direct phone call.
Less Than 5% of Subscribers Opt out
The latest text message marketing statistics disclose that less than 5% of subscribers opt out of campaigns. On the other hand, more than 20% of email marketing recipients unsubscribe each year. This shows that the subscriber retention rate of text marketing is significantly higher than that of email.
